

Analyzing behavioral patterns to map issue and opportunities
 Alex Genovese
Through cohort analysis and others, it's possible to get an overview on browsing and purchasing behaviors of customers. Understanding these data allows you to use them to improve business metrics and increase performance of marketing campaigns.
For example, finding a group of customers which has visited a specific product many times, in a relatively short time, we can assume an interest in the product. But what are the obstacles for others to complete the purchase process? Answering these questions means increasing e-commerce performance and decreasing pitfalls.
It's common practice to use a timeline scheme that allows you to map aggregate behavioral patterns from acquisition to checkout, focussing on touchpoints, on what the customers think, objectives and actions.
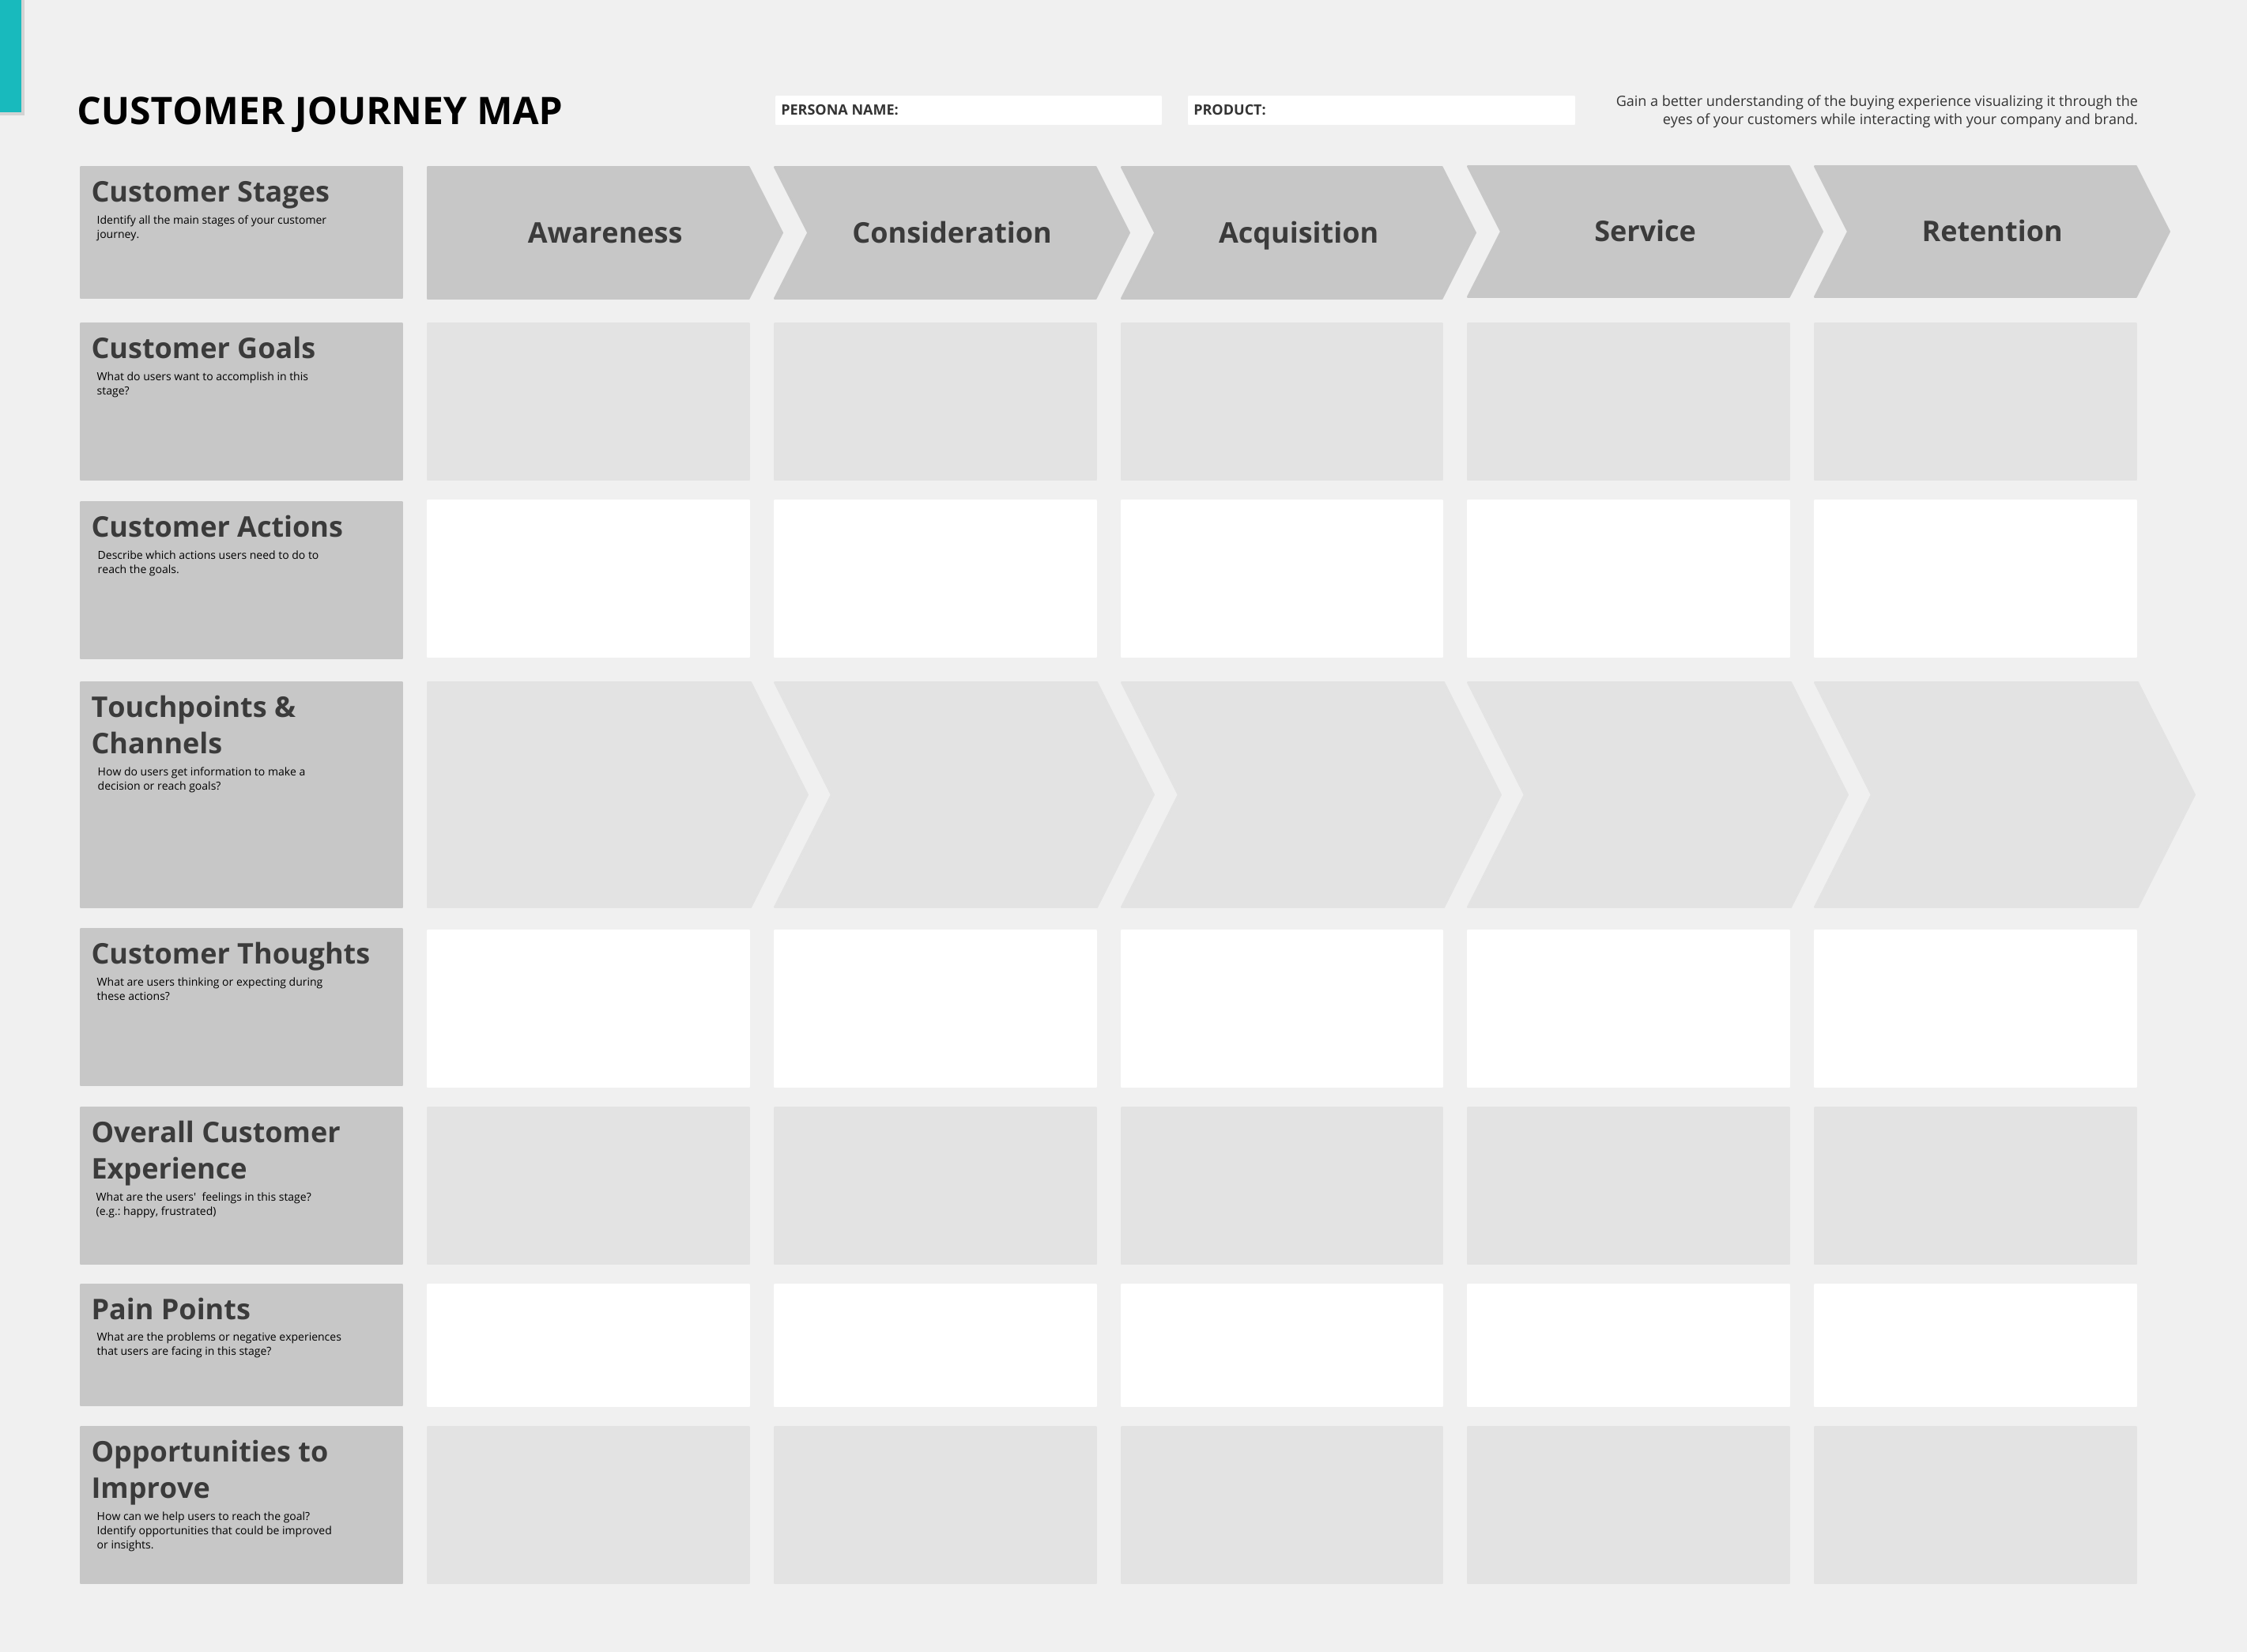
This analysis allows you to map the most common behaviours in general and evaluate the impact of strategies or tactics at each stage through KPIs. This will enable you to quickly see which areas are most problematic and hone in on the specific touchpoints that require much attention.
Once customer segments have been identified (RFM analysis) and their browsing behaviour understood through the quantitative analysis, we can group them by almost the same metrics (Purchase and Browse); these are used to create maps of their Journeys.
There are even simpler Customer Journeys than this one, like that suggested by the Nielson Norman Group, which you can find by following this link.
Microanalysis
Behavioural micro-analysis enables another level of understanding, intercepting a specific and repeated pattern time over time that concerns the resolution of a user's task, which is part of a "subsection" of his journey, such as a request for detailed information to customer care, or create a configurable product, etc.
Example: 2 or more sessions on a product page where you spend at least 10 seconds more than the average + X seconds spent in the cart.
Using data for creating a Customer Journey
Below you will find a detailed guide on how to complete the Customer Journey.
Customer Goals
Define goals for each funnel stage
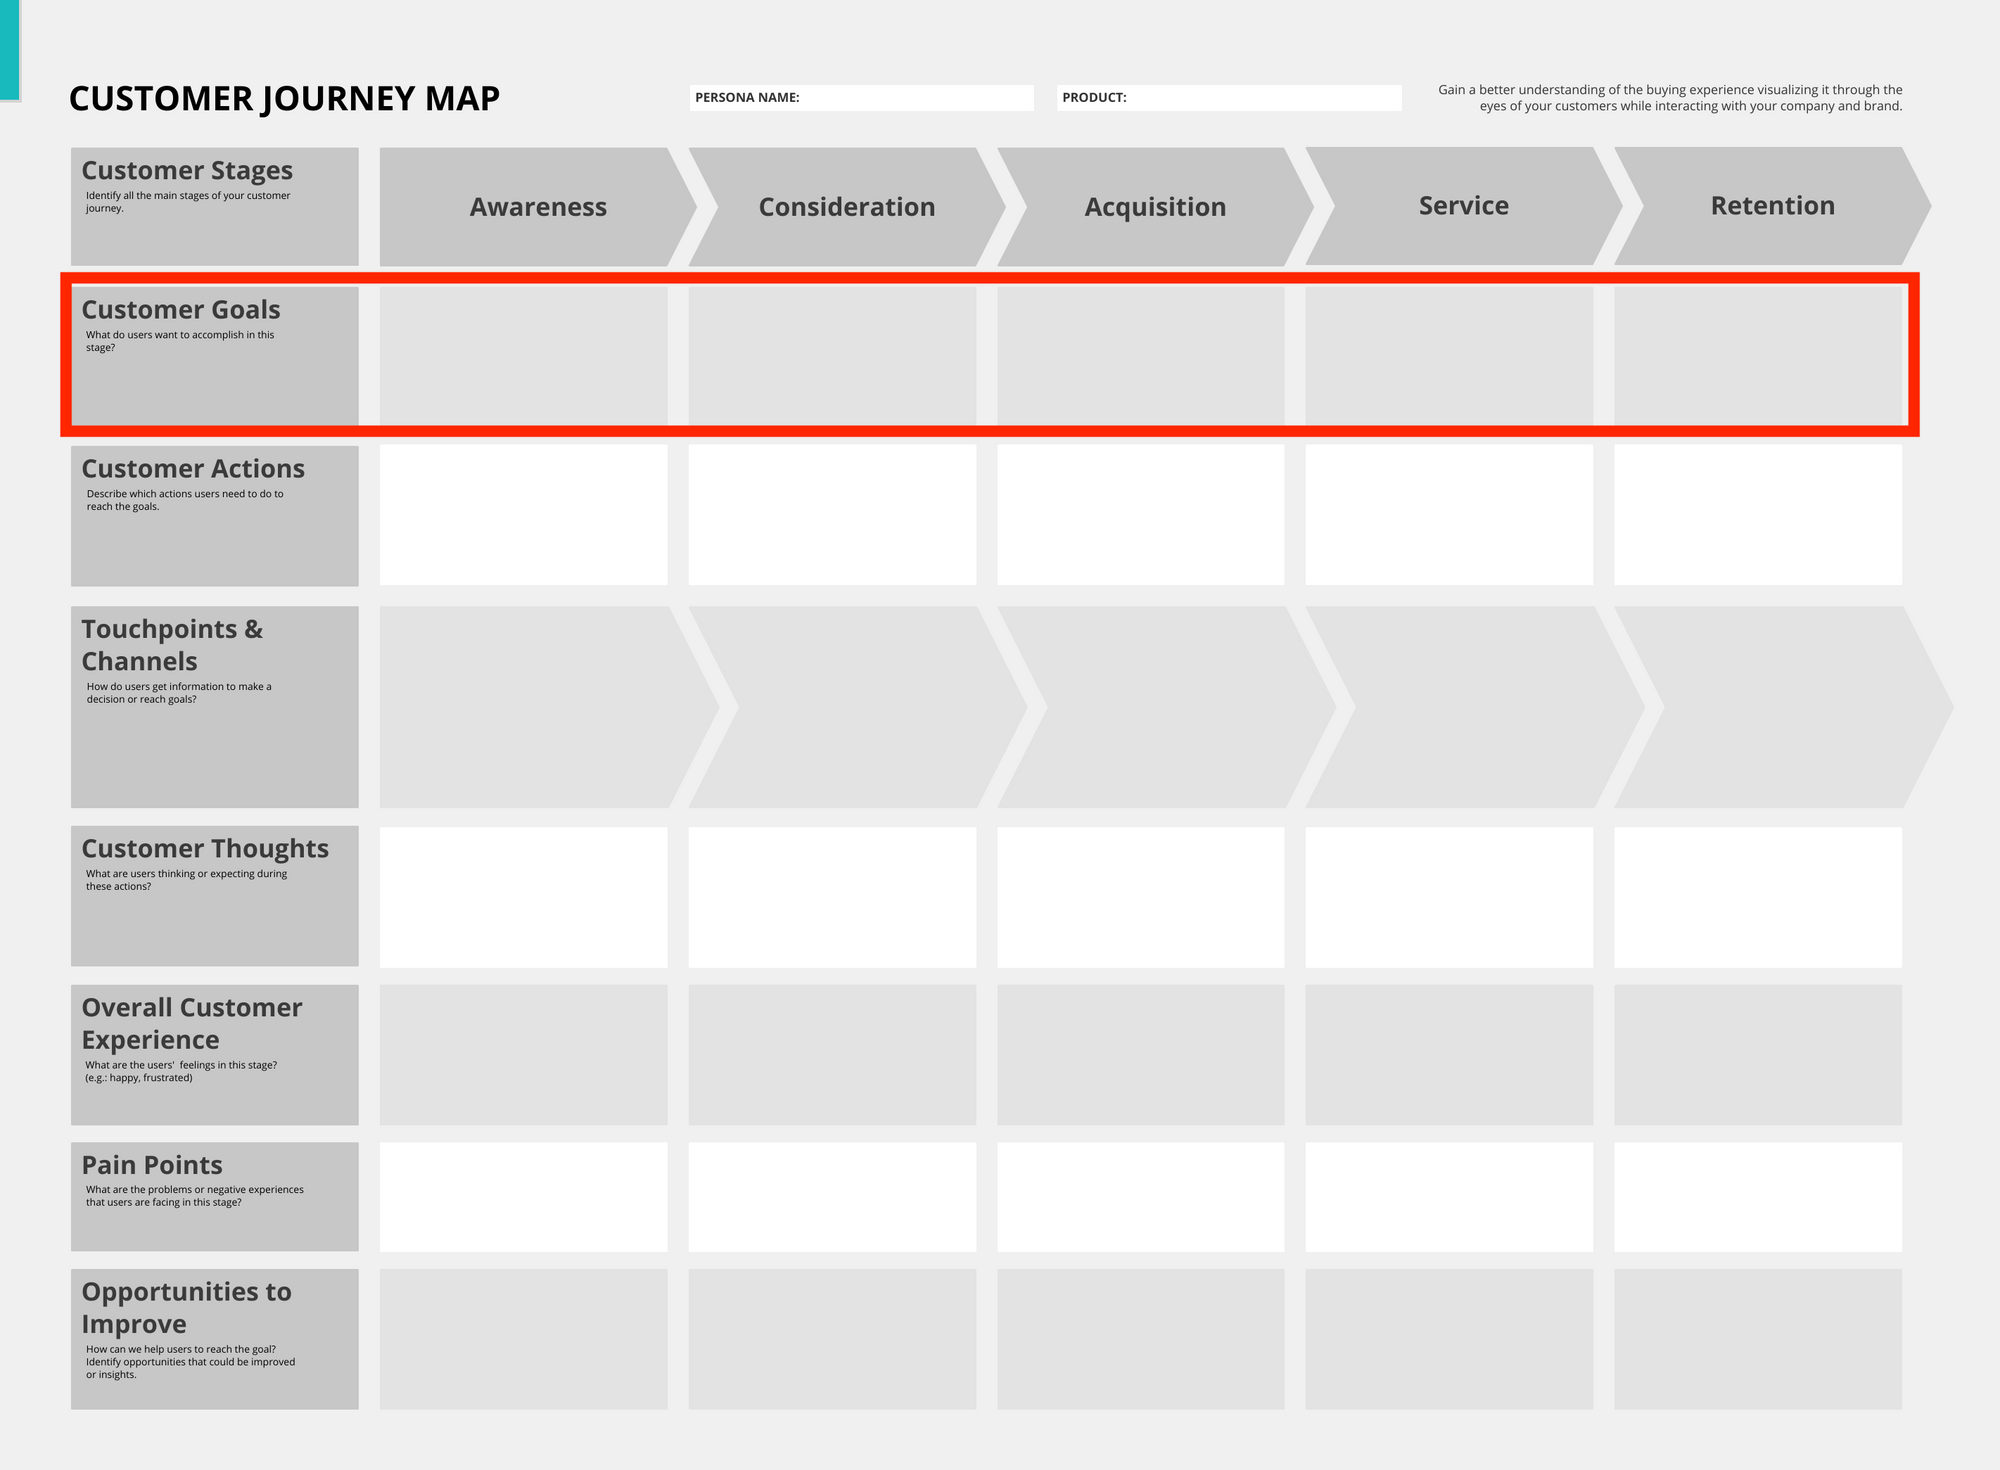
At our discretion, we define the objectives for each advancement step in the Customer Journey funnel, in order to analyze with objective metrics the success or otherwise of the tactics that are applied to achieve them.
Below I listed some examples with a different scope depending on client cluster being considered.
Awareness
When a customer due to searching a specific need he comes in touch through organic or sponsored positioning of the company, for the first time.

- They click on the Ads (for example, banner, programmatic, etc.)
- Click on the link at the end or in the description of the spot video
Metrics
The definition of success values can be determined using previous campaigns carried out or using market metrics available by ad partners.
- It's successful if the CTR is higher than X%.
- The values are communicated in the new collection (via video) if the view time is above then 50% of the total video length + CTR > Y%.
Consideration
When a person actively evaluates the products that a company offers and they are willing to buy the proposed solution.

- The user follows the link to evaluate a PRODUCT.
- The user follows the link to a promotion and fills out a form to leave his email.
- The user followed the link, sent by mail and went to a landing page
Metrics
- The navigation time (after the awareness phase) has a value higher than 30% of the average;
- The bounce Rate is lower on average by 20%, and a number of pages per session + is 20% higher.
Acquisition
They decide to buy and enter the purchase process, which starts with the cart page and ends with the Thank You page.
- Purchase of one or more products
- Higher average cart thanks to the X promotion
Metrics
- Enrollment rate X%
- Conversion Rate of promo products of Y%
- Average cart value higher than +25%
Service
Beyond the merchandising composition, which can be viewed as something to intercept customer's needs, nowadays, the game is played in these phase. Making a perfect and excellent service makes the customers happier, gaining them more trust in the company.

- Leave feedback
- Request more information using live chat
- Find the coupon in the package and request more information
Metrics
- Feedback must be above the average within 5 days of delivering it
- Request more information using live chat
Retention
Retention is a fundamental link to increasing online sales and maintaining a position in the market.
- He believes that the products purchased are interesting and buy back thanks to a promotion sent by email after X days;
- Shares a promotion through social channels.
Metrics
- Retention Rate;
- Promotions sharing is higher than X%.
Customer Actions
Action they need to take to move on to the next stage
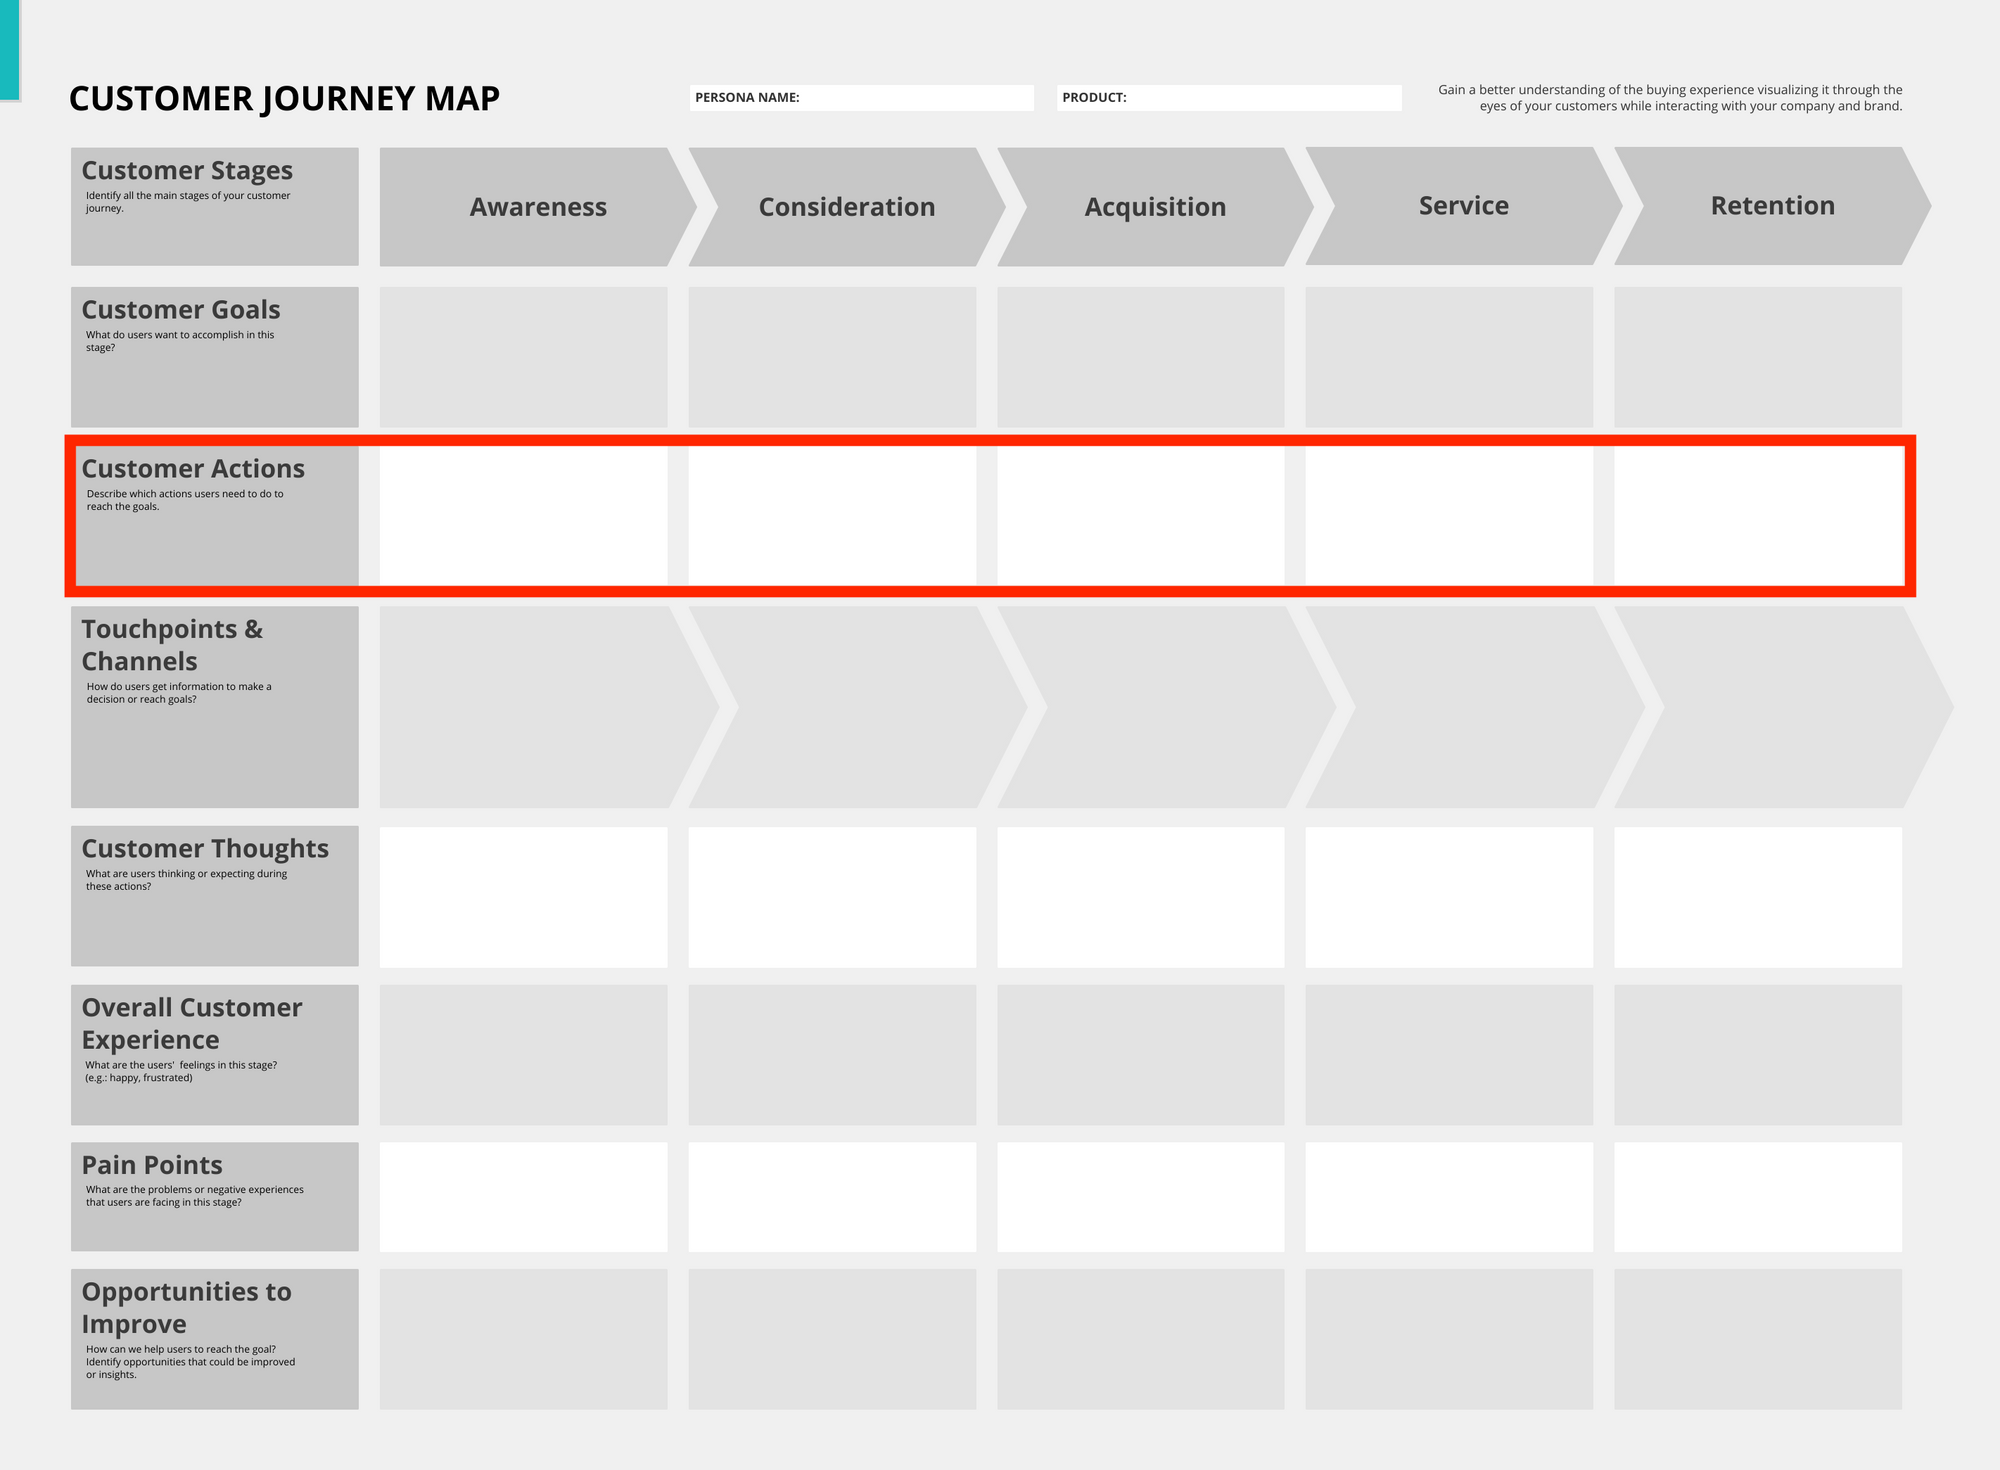
The actions are determined by the behaviour that a user assumes in the funnel phases when watching a communication, a page or a product that is able to facilitate his path to the checkout.
Examples of actions:
- Awareness: click on sponsored ad;
- Consideration: view and stay on the product page for X seconds;
- Acquisition: add product to the cart and proceed to checkout;
- Service: leave feedback;
- Retention: buy back specific products or others (depends on the journey being mapped).
Below there is a larger list that may be helpful:
- Wants to buy shoes
- Clicks ad to landing page
- Browses in e-Shop
- Goes through Checkout
- Lands on the Thank You page
- Waiting for the Package
- Receives the Package
- Tries on PRODUCT – Do not fit
- Tries on PRODUCT – It does fit
- Wants to send the PRODUCT back – But does not understand the process
- Wants to send the PRODUCT back – All went fine
- Call Customer Care to ask questions about return or shipping problems
- Carries out the return process
- Waiting for returns confirmation
- Waiting for credit
- Receives newsletter evaluation campaign
- Gives rating
- Gives feedback
- Uses a coupon for the first purchase
- Uses a coupon for the second purchase
- Uses discount X to purchase again
Touchpoints & Channels
Opportunities we can use to communicate with users
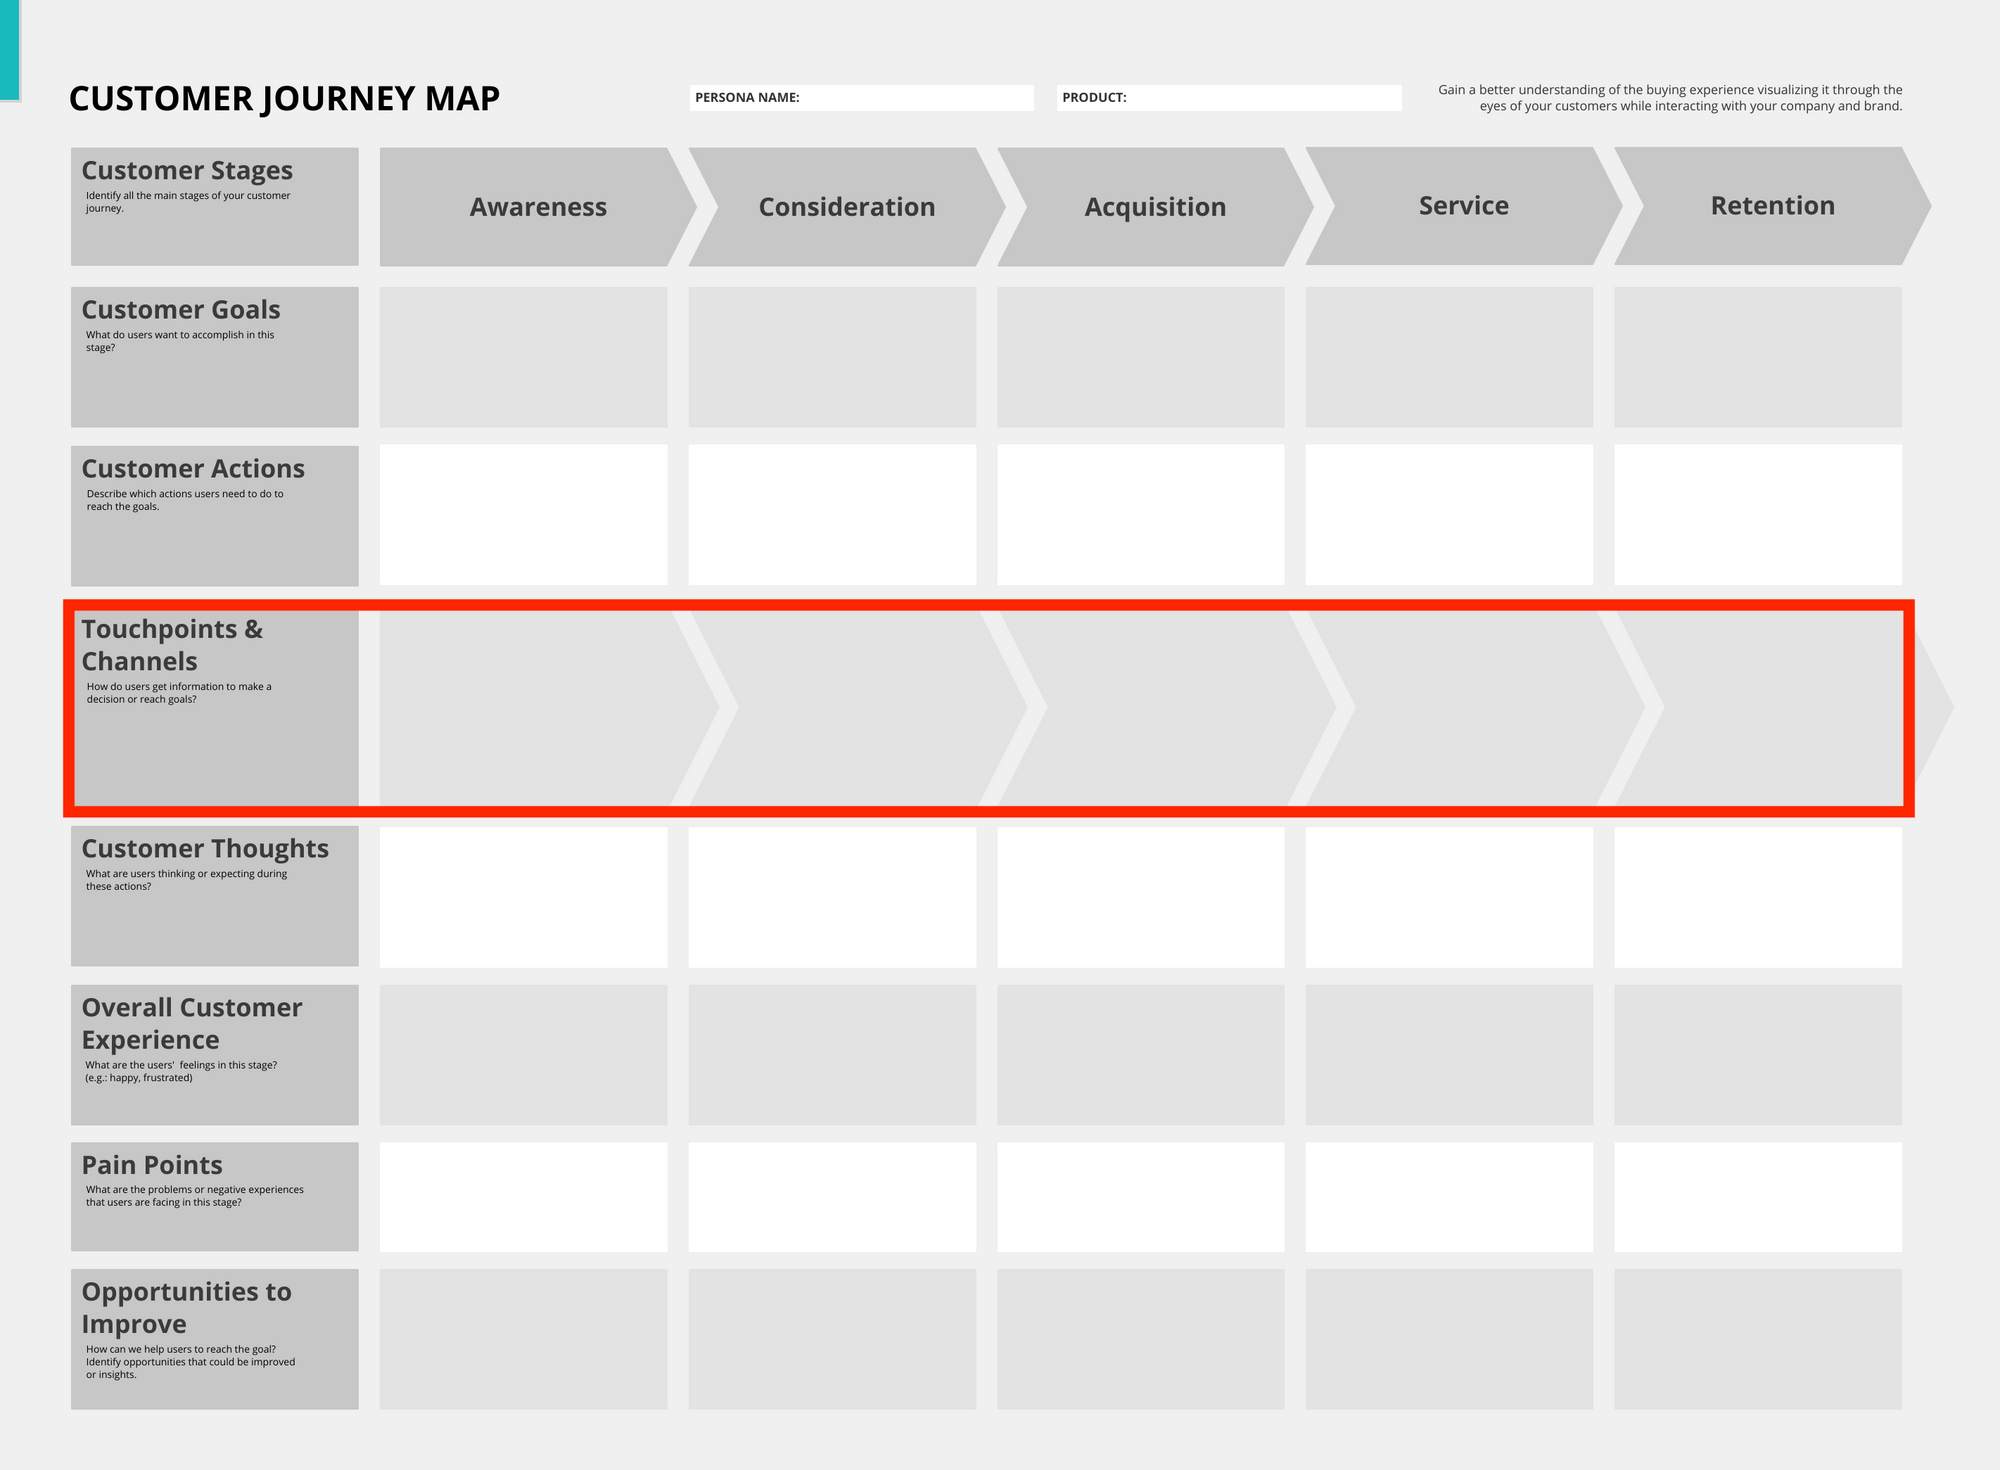
I created below a list that I usually use to fill out the cells of the different phases. The list is used to understand better the areas where a customer or potential one comes into contact with the company.
- E-Commerce: homepage, category, product, etc.
- Ads: banner, video, gif, ecc.
- Blog post
- Mail: newsletter, automation, etc.
- Landing Page: offers, promo products, coupons, etc.
- Mobile application
- Thank You page
- Shipping updates
- Login
- Packaging
- Bill
- FAQs
- Customer Care: phone call, mail, live chat.
Customer Thoughts, Overall Customer Experience
Using surveys on specific pages to get unknown data
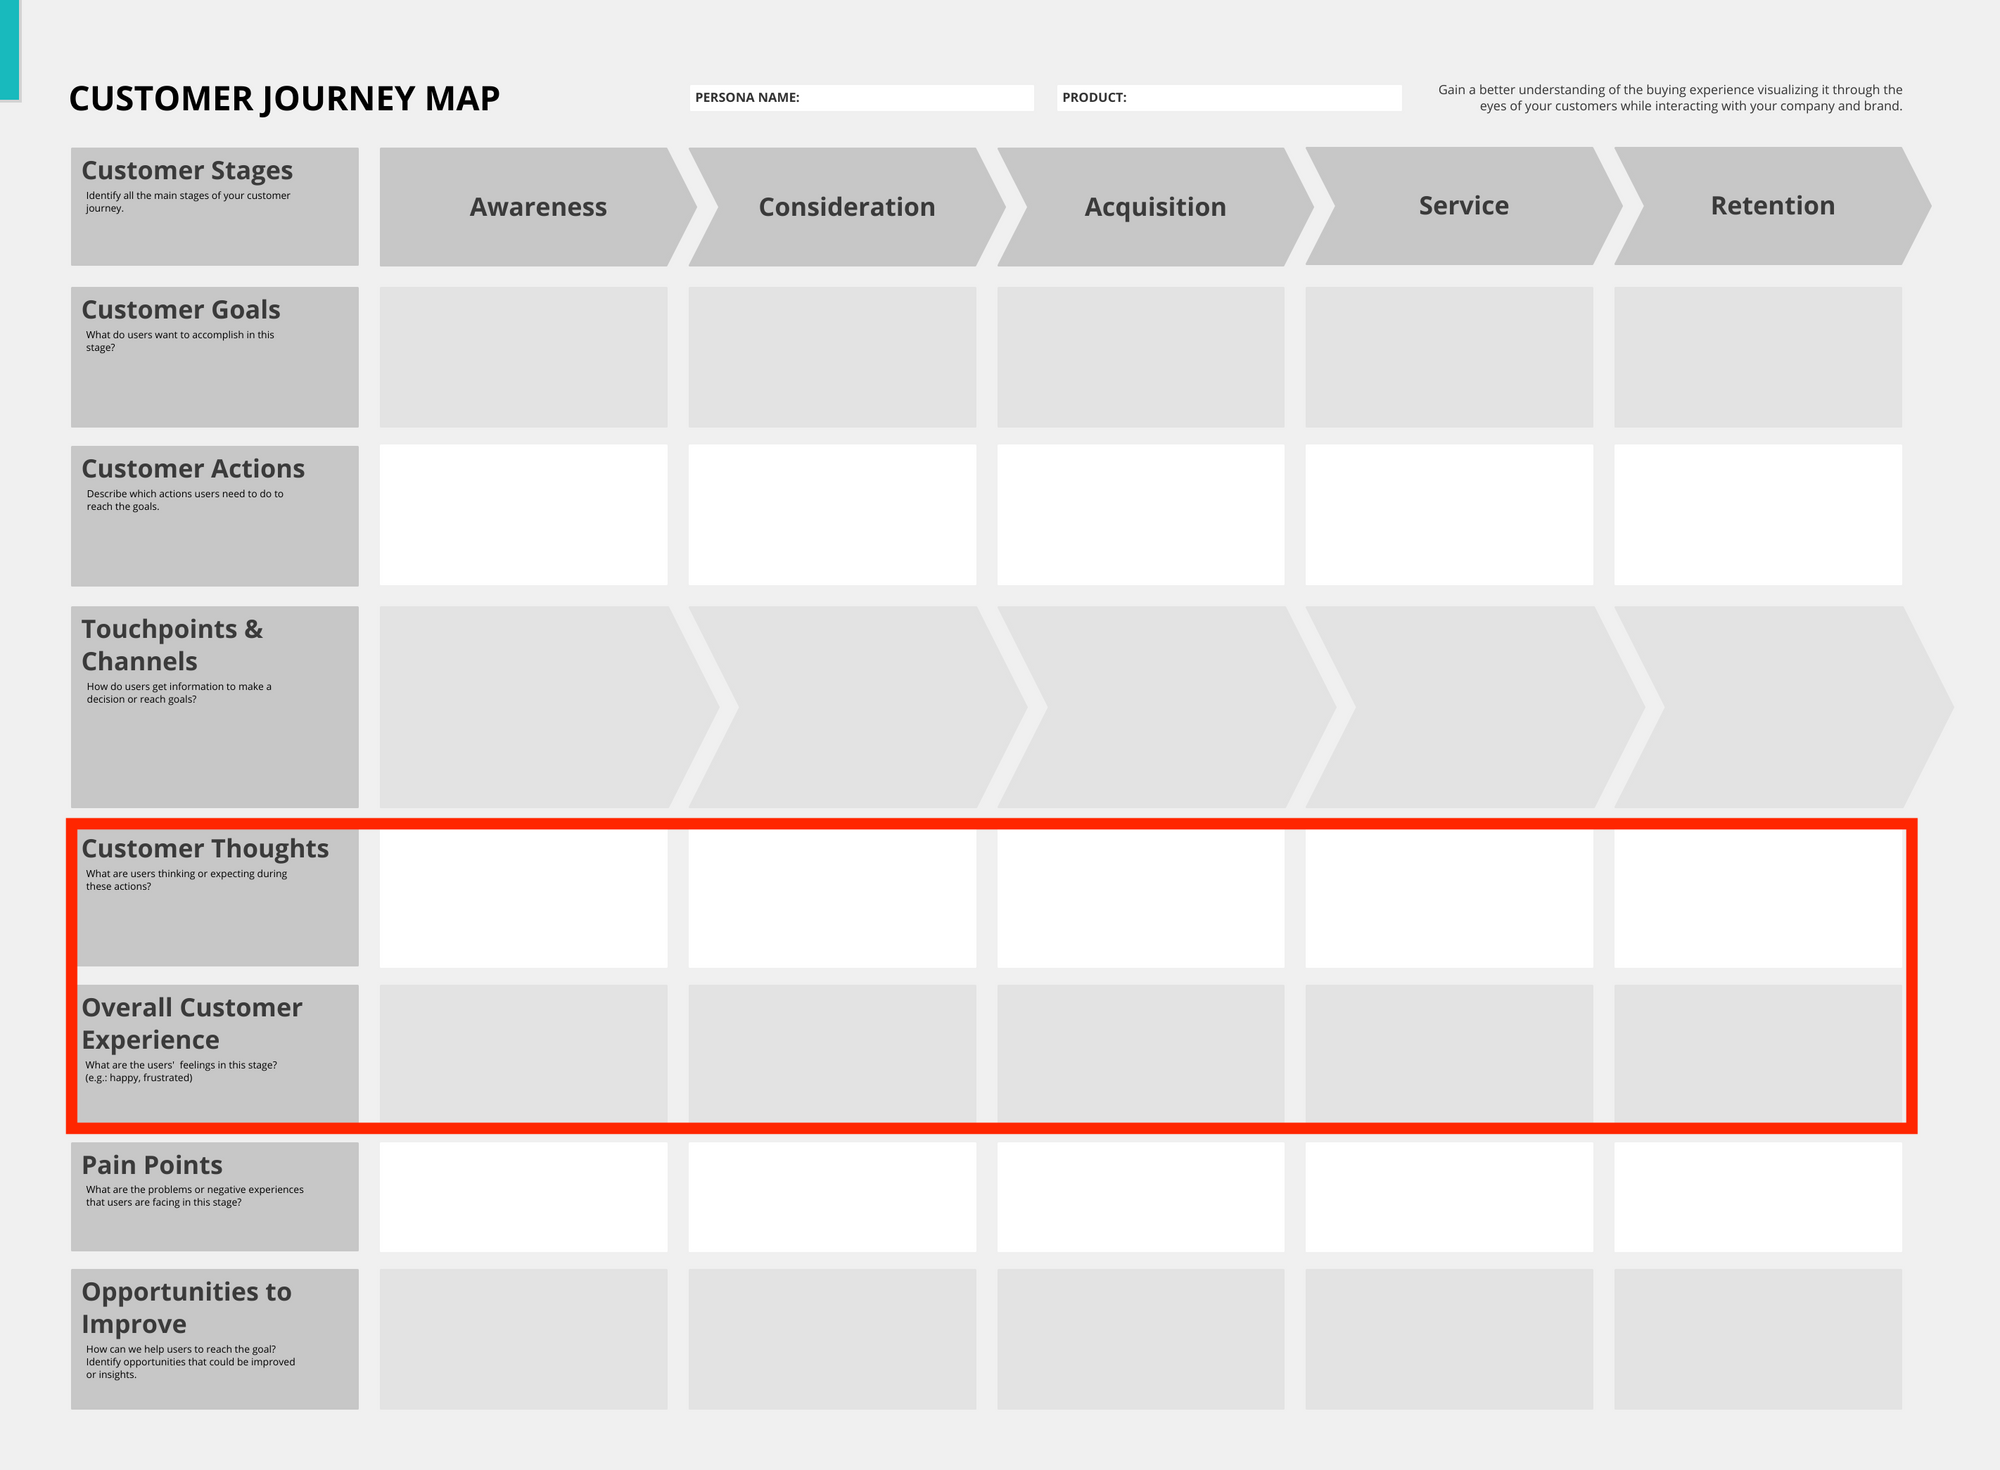
Continuously collect feedback from your customers because only in this way can it be possible to map several areas of their journey and not make the usual mistake of hypothesizing / assuming what they think or what they are experiencing when using the service you build.
The three types of customers to whom the surveys are usually sent:
- who find the offer but do not buy
- who buys only once
- who buys back often
Using appropriate survey tools, it's possible to analyze customer answers by segmenting them into clusters of our RFM analysis and, therefore, being able to include them in the Customer Journeys that represent them.
Pain Points
Identify problems or unclear aspects.
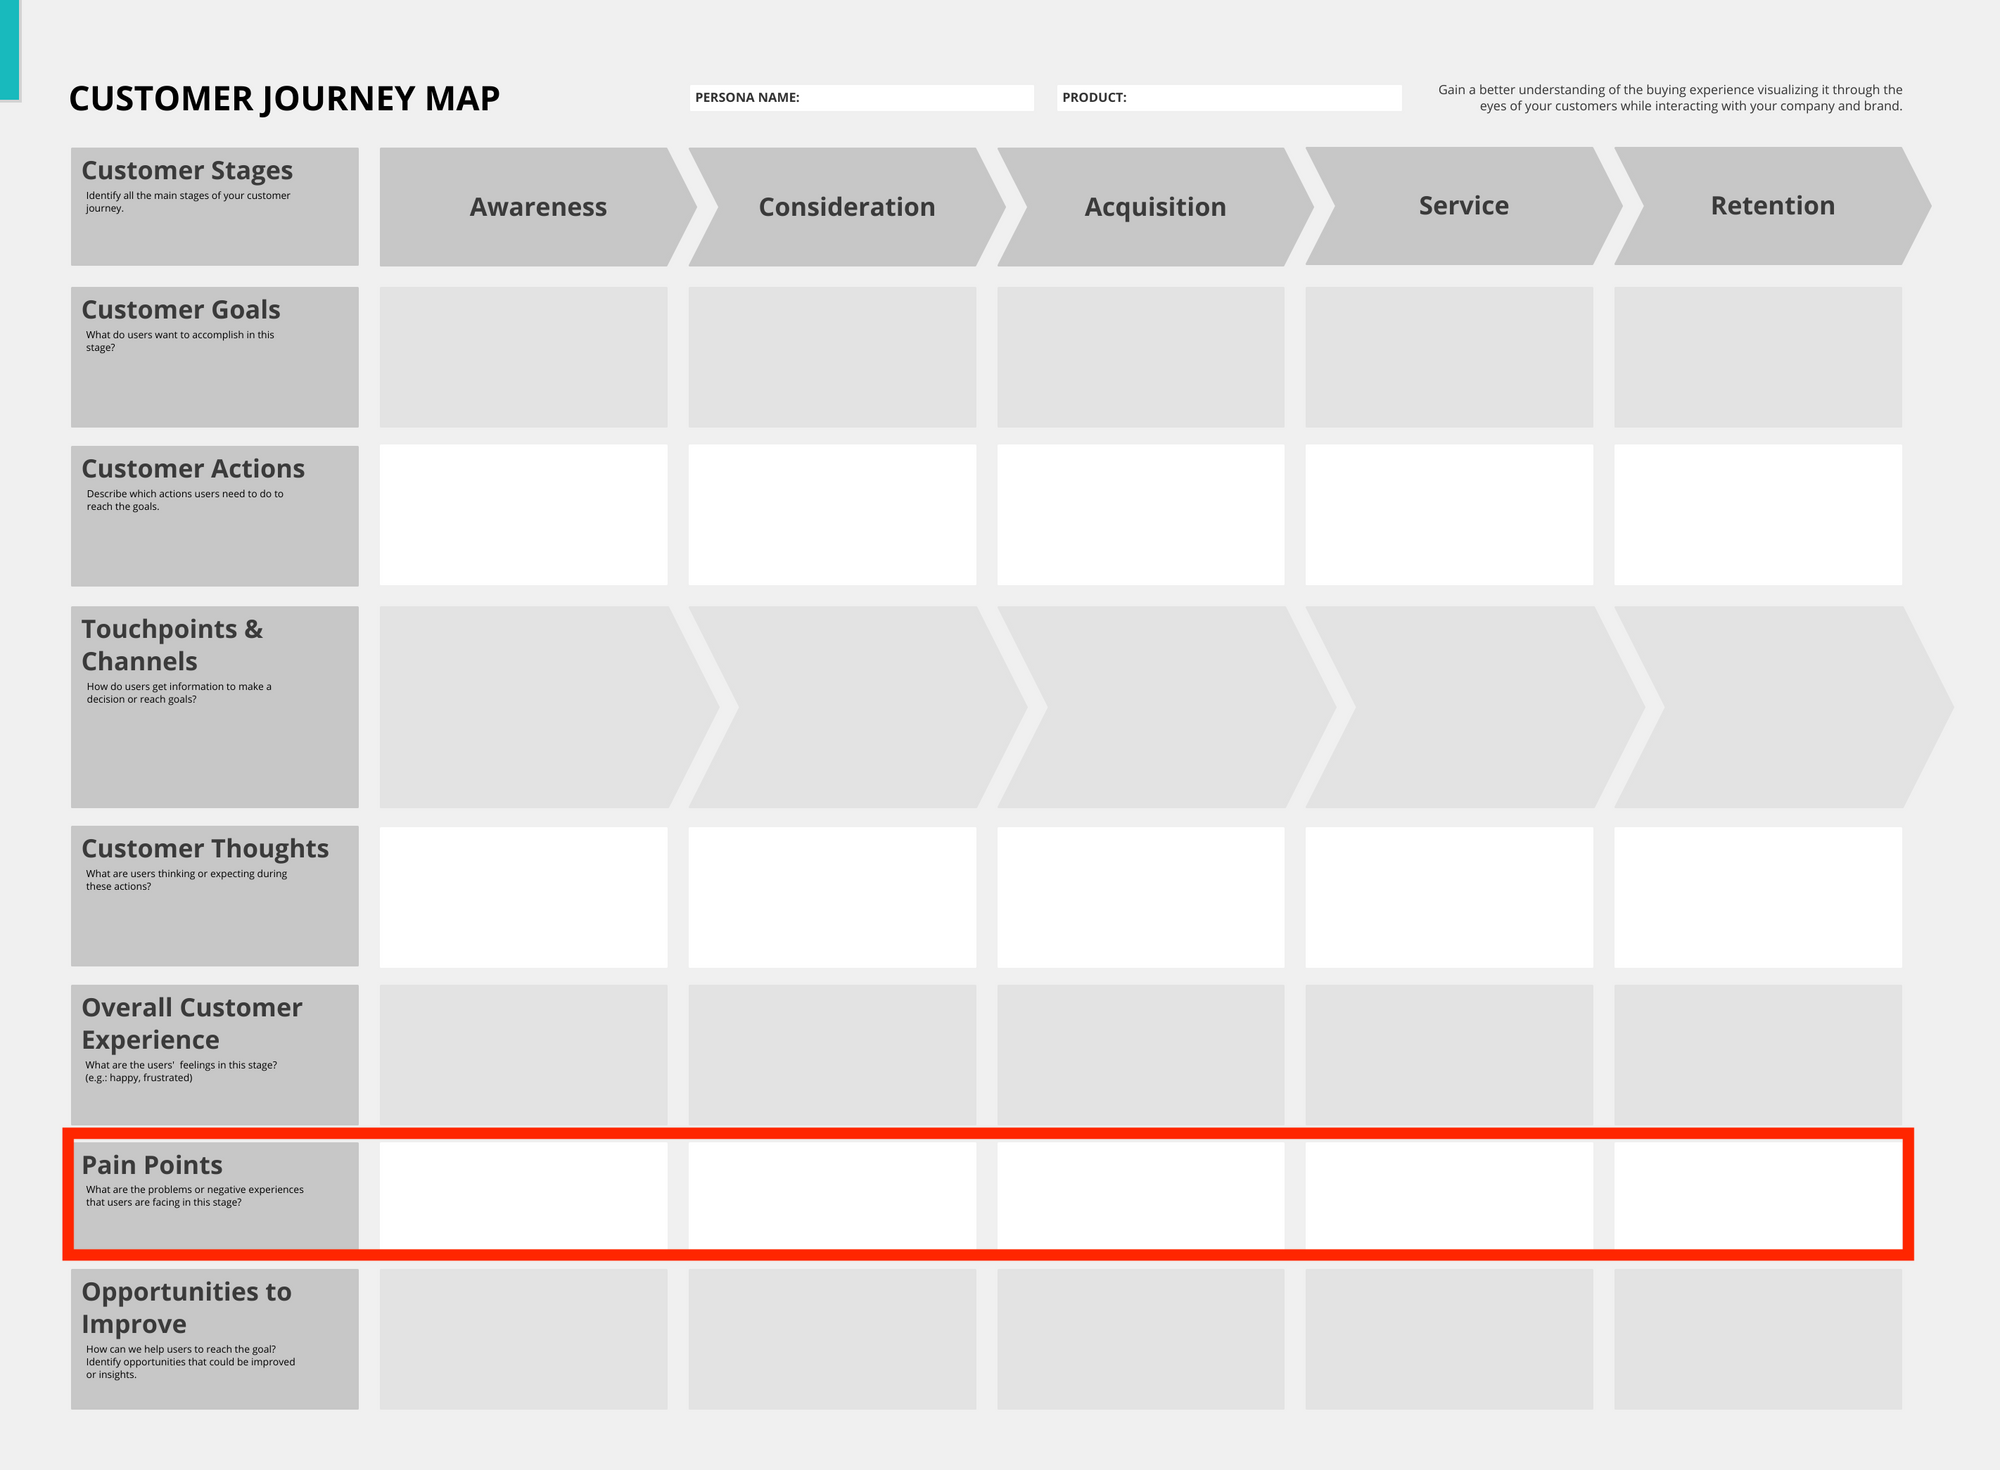
Live chat or a call centre can acquire important information to understand the unclear aspects of data. For example, it's possible to understand why a customer is unable to purchase from the product page due to his browser's old version or device that doesn't allow him to view the Add to Cart button because it is not shown in the "above the fold".
The important thing is to map all incoming "tickets", provided by all customer care channels, labelled in a way that makes able to group problems into categories such as:
- UX issues (ex: I can't buy because...);
- Shipping process issues (pick & pack, warehouse, carrier, etc.)
- Product issues (ex: I cannot understand if the size is the right one)
- etc.
Opportunities to Improve
Task list to be tested for improvements
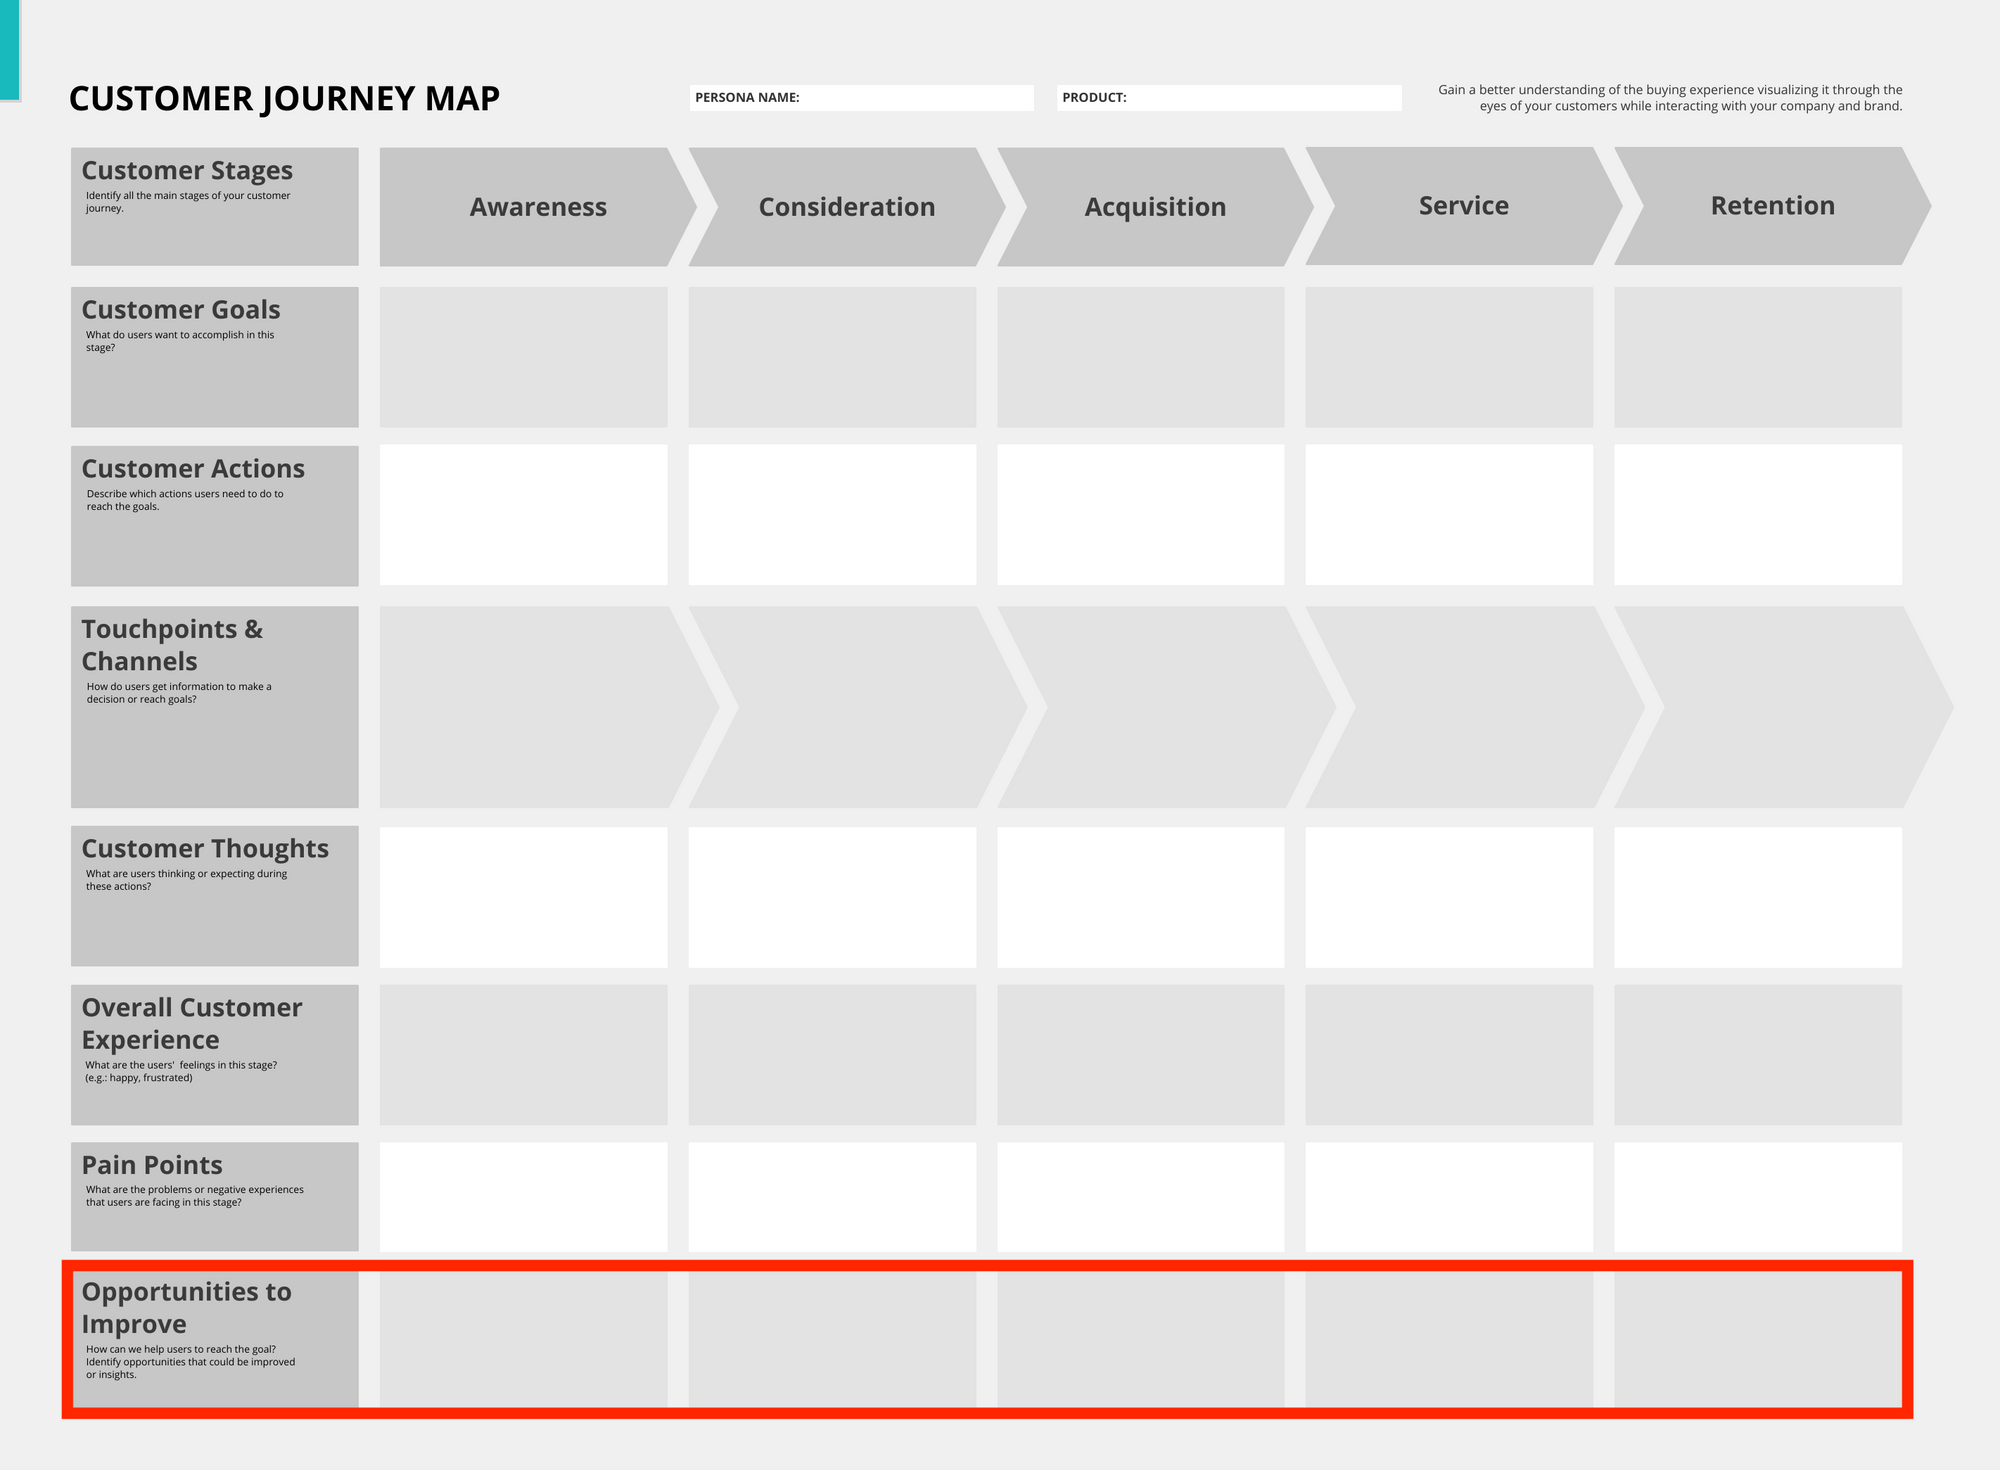
By identifying what is not working thanks to the KPIs of each phase and the Pain Points acquired, we have a list of "Backlogs" or activities that can be carried out in the short, medium and long term. The activities should be prioritized (e.g., PIE framework) according to the potential revenues that can be generated and the timing for their resolution.
If you are a Business Model Canvas fan, you can use the Testing Cards to keep track of the experiments and bring more and more information about Personas. Also, you can update the Value Proposition Map according to the test type you will carry out.